markokojicki/AR Campus

AR Campus

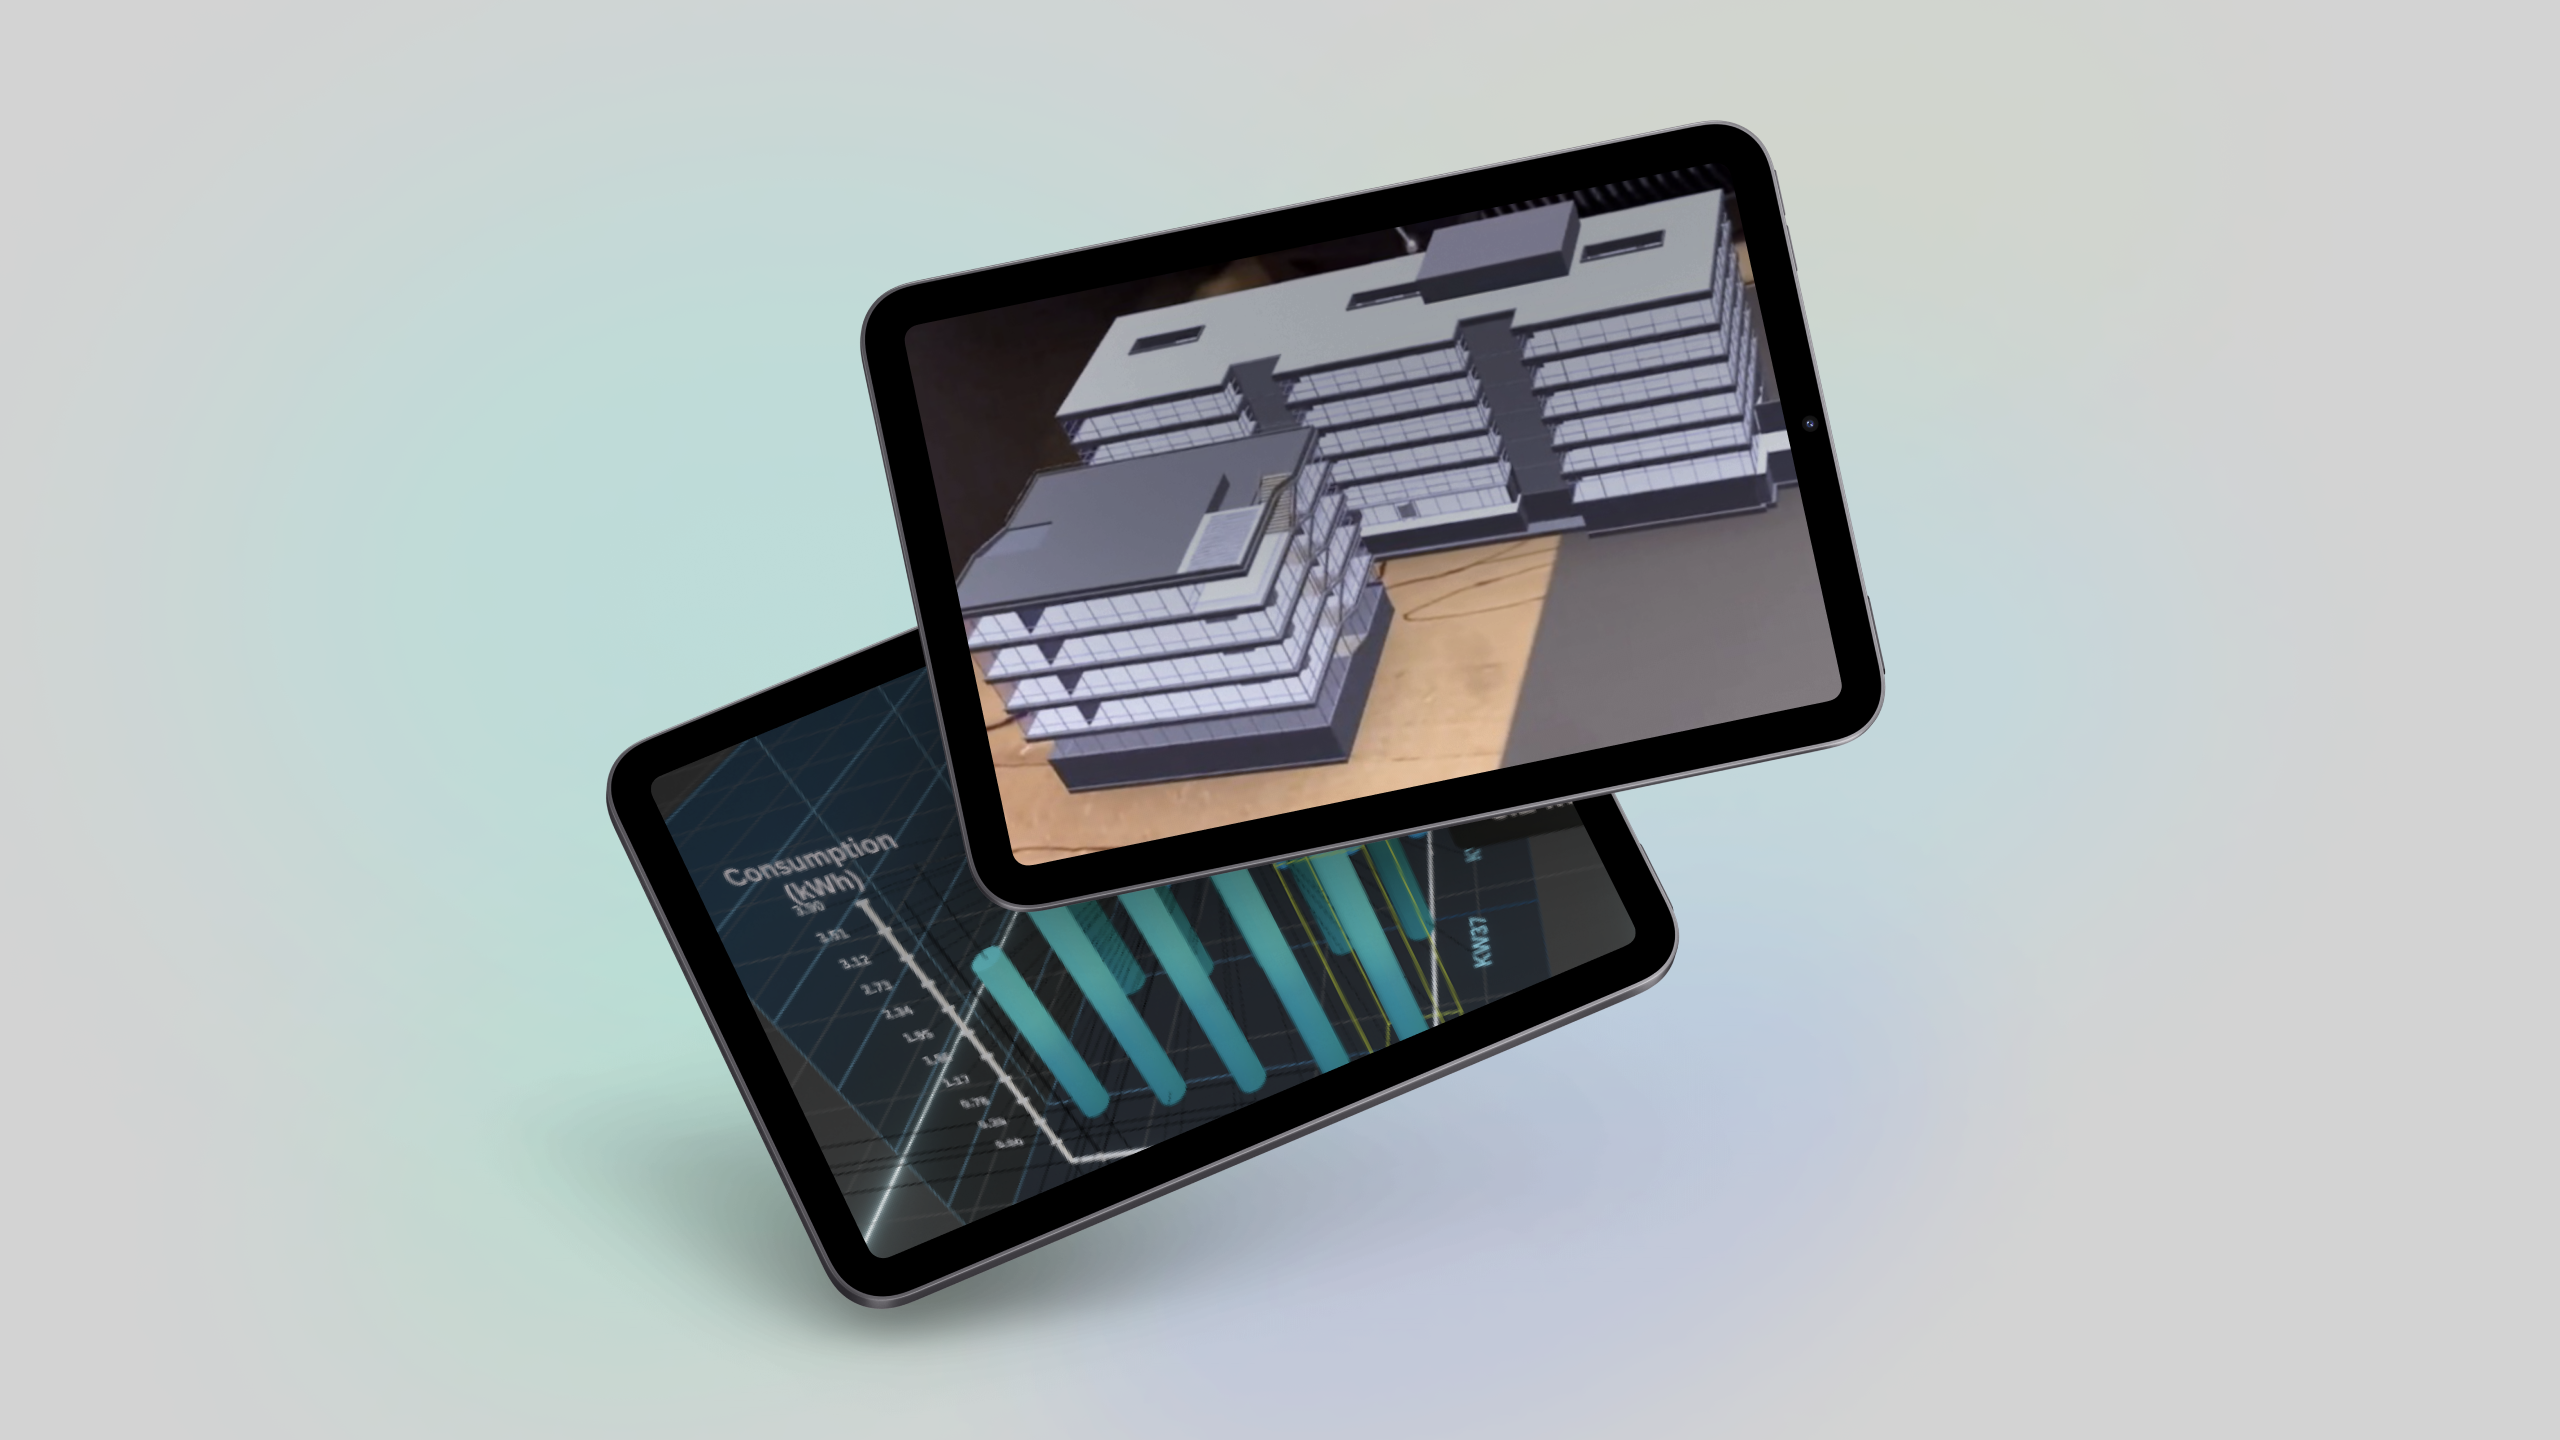
AR experience: showcasing innovative way to track energy consumption in smart buildings.

Company

SAP

Tags

2022ExperienceUX/UIXR
UX Designer, Work study
2022

As part of a dynamic team of designers and developers, I contributed to the project by being involved in design thinking workshops defining the scope, use cases, and tech feasibility, as well as contributing to research, conception, generating interaction flows, UI, and producing 3D models in Blender and Reality Kit.

About

๐Ÿ’ฅ Project

Comprehensive view of AR Campus platform showing energy visualization in augmented reality

๐Ÿš€ Key objectives

Enhanced Transparency

To enhance transparency by visualizing sustainability measures in SAP buildings in an innovative way.

Future of Work

To drive and shape the future of work by facilitating work processes in the future.

Technology Trends

To keep up with current technology trends, especially with the anticipated launch of the Apple glasses.

Ideation, research, and definition processes
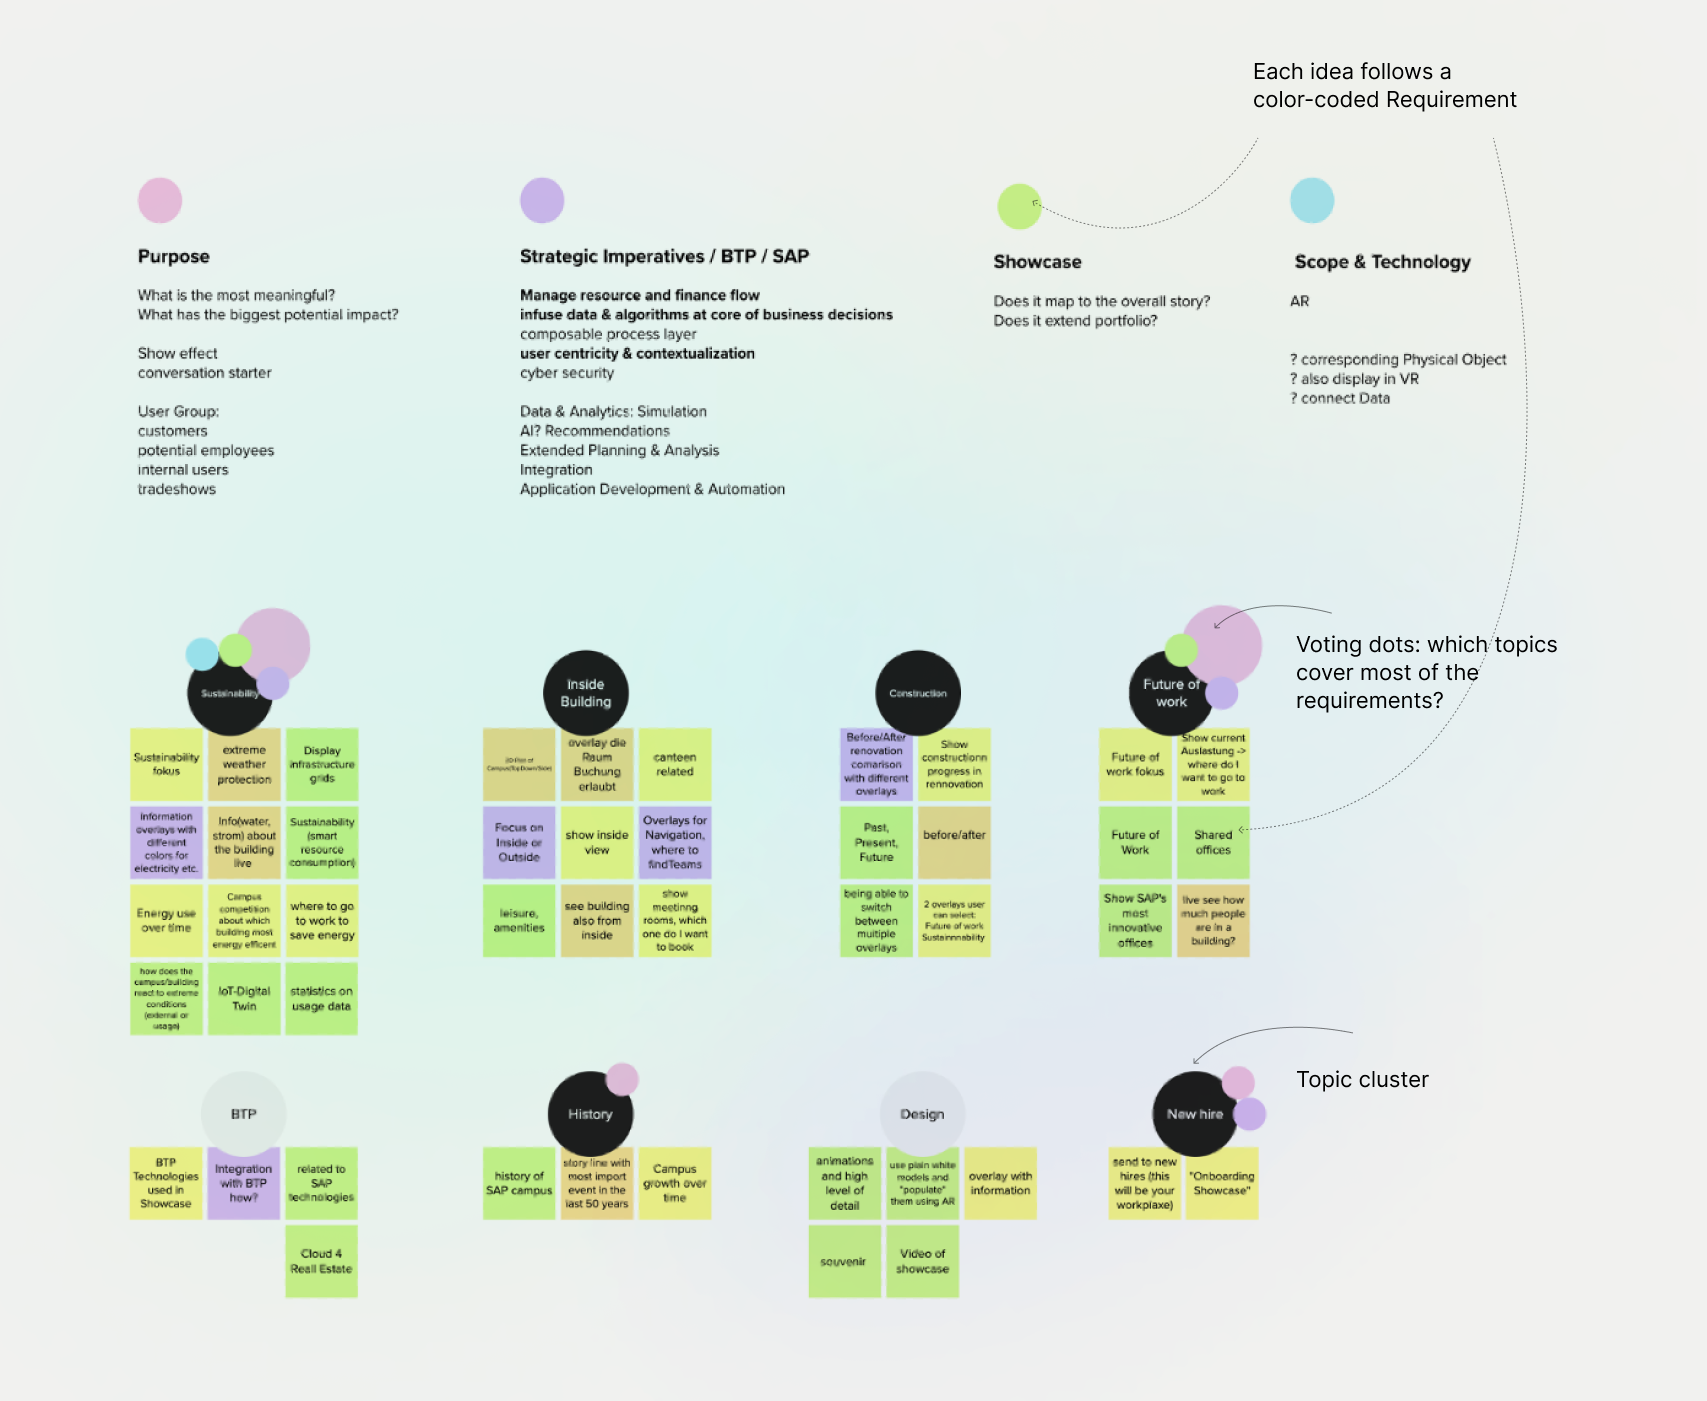
๐Ÿ’ญ Ideation workshop

Ideation workshop with color-coded sticky notes showing different topics like sustainability, building information, and energy use organized into categories

๐Ÿ“– Research

Interesting insight

Energy consumption during the pandemic was not much lower than expected.

๐Ÿ“ฃ Stakeholder communication

Conception and prototyping
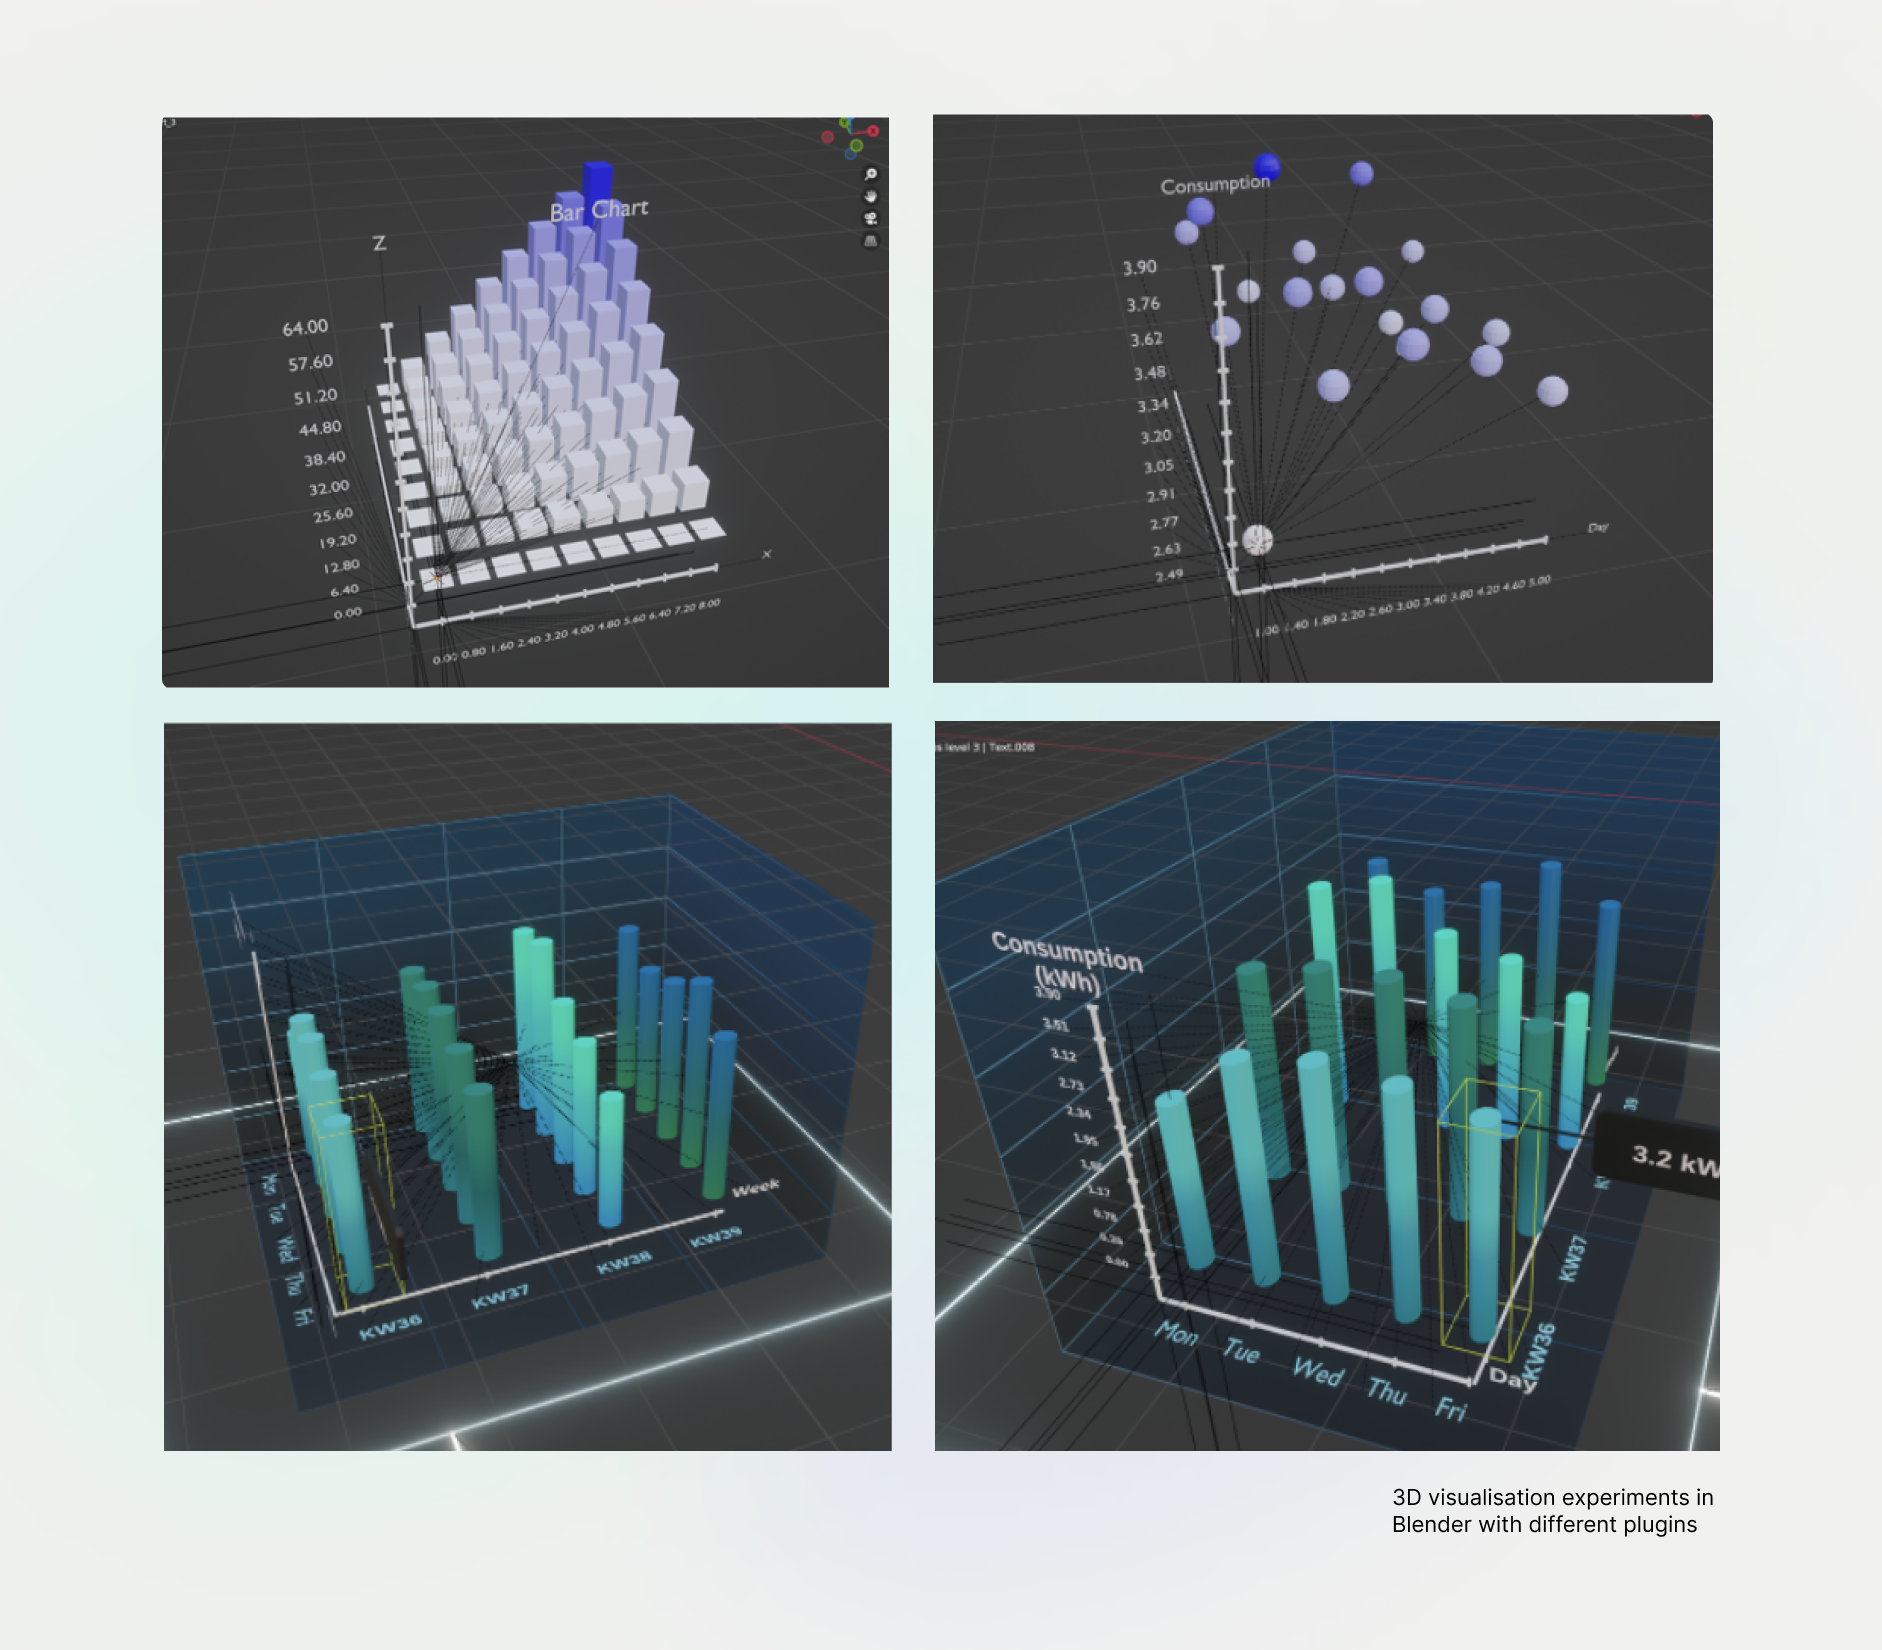
๐Ÿงช Concept & tech stack

Outcome

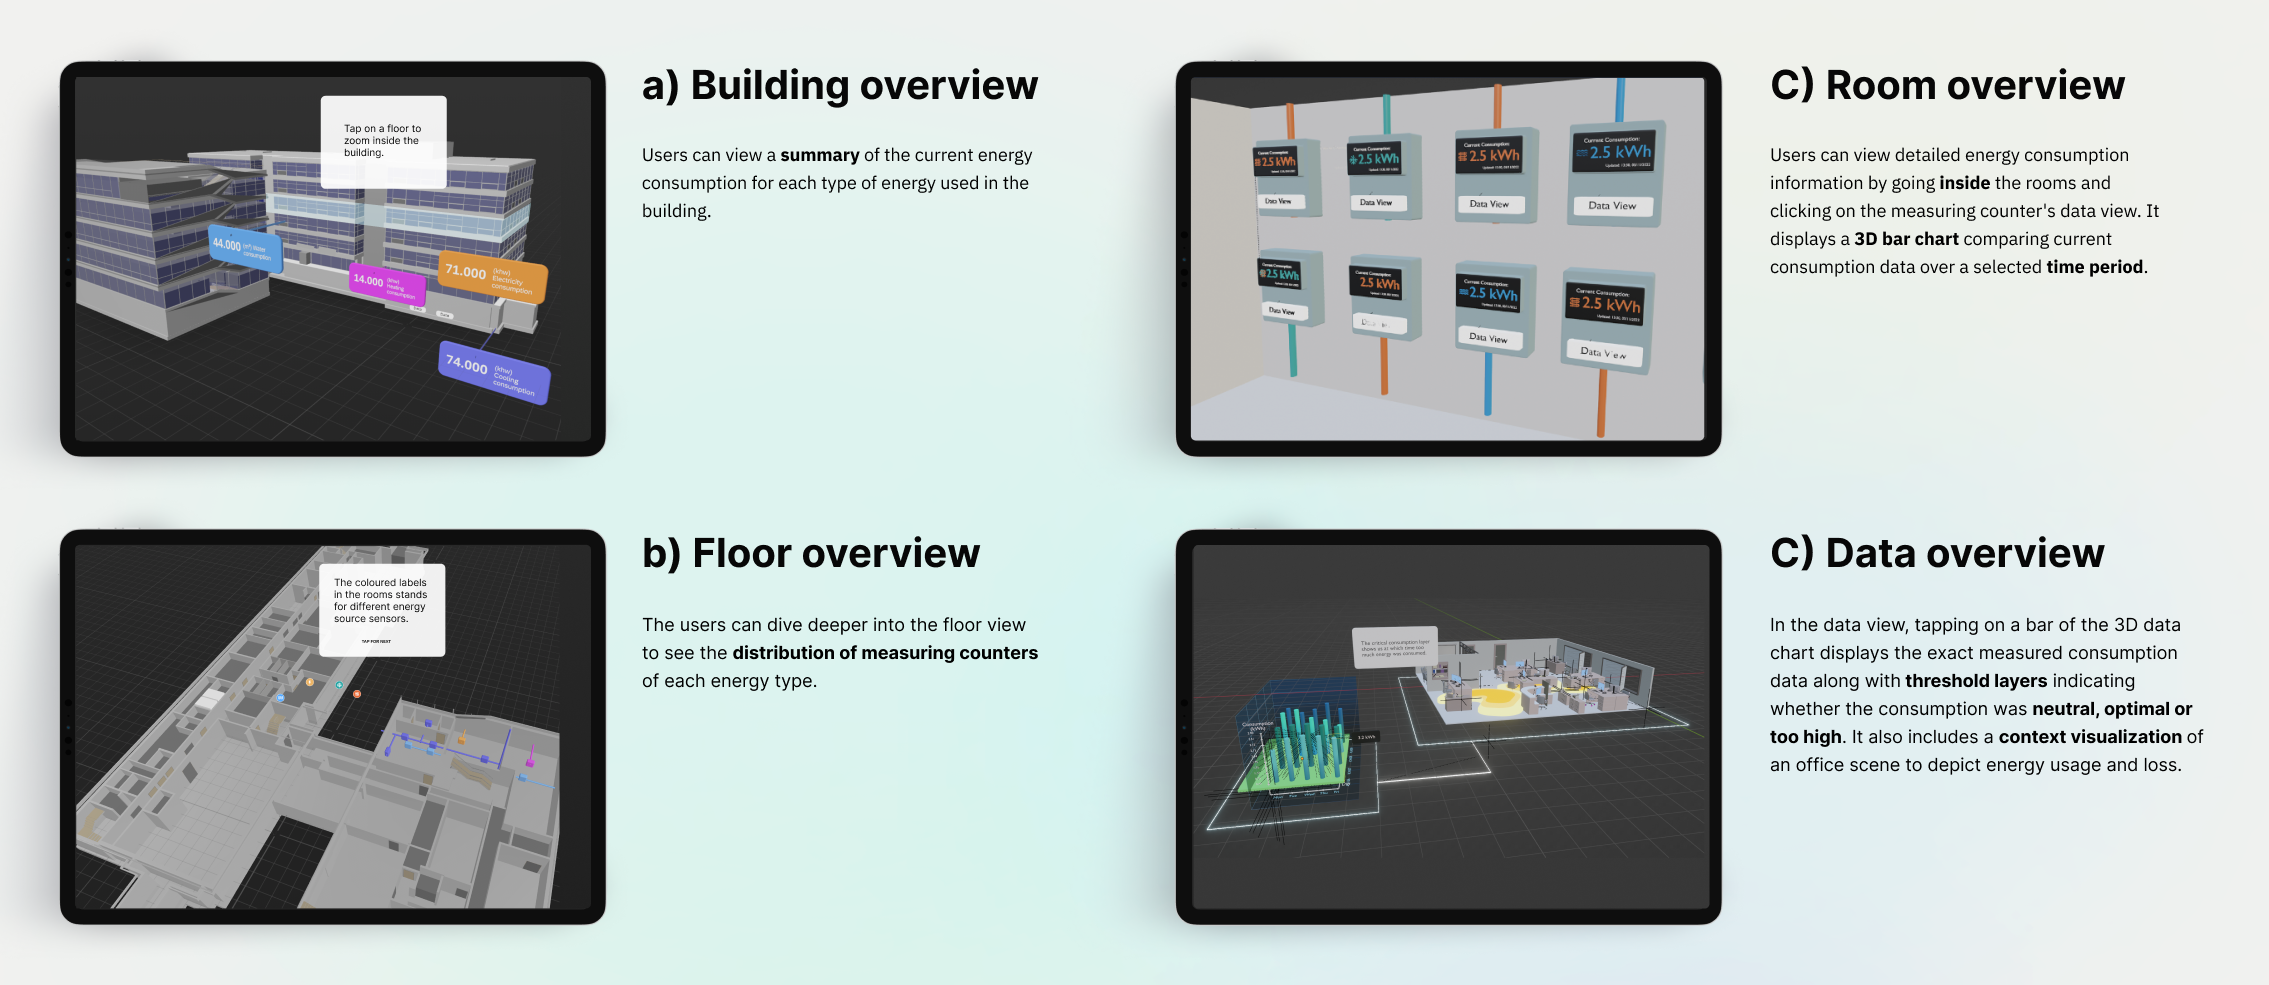
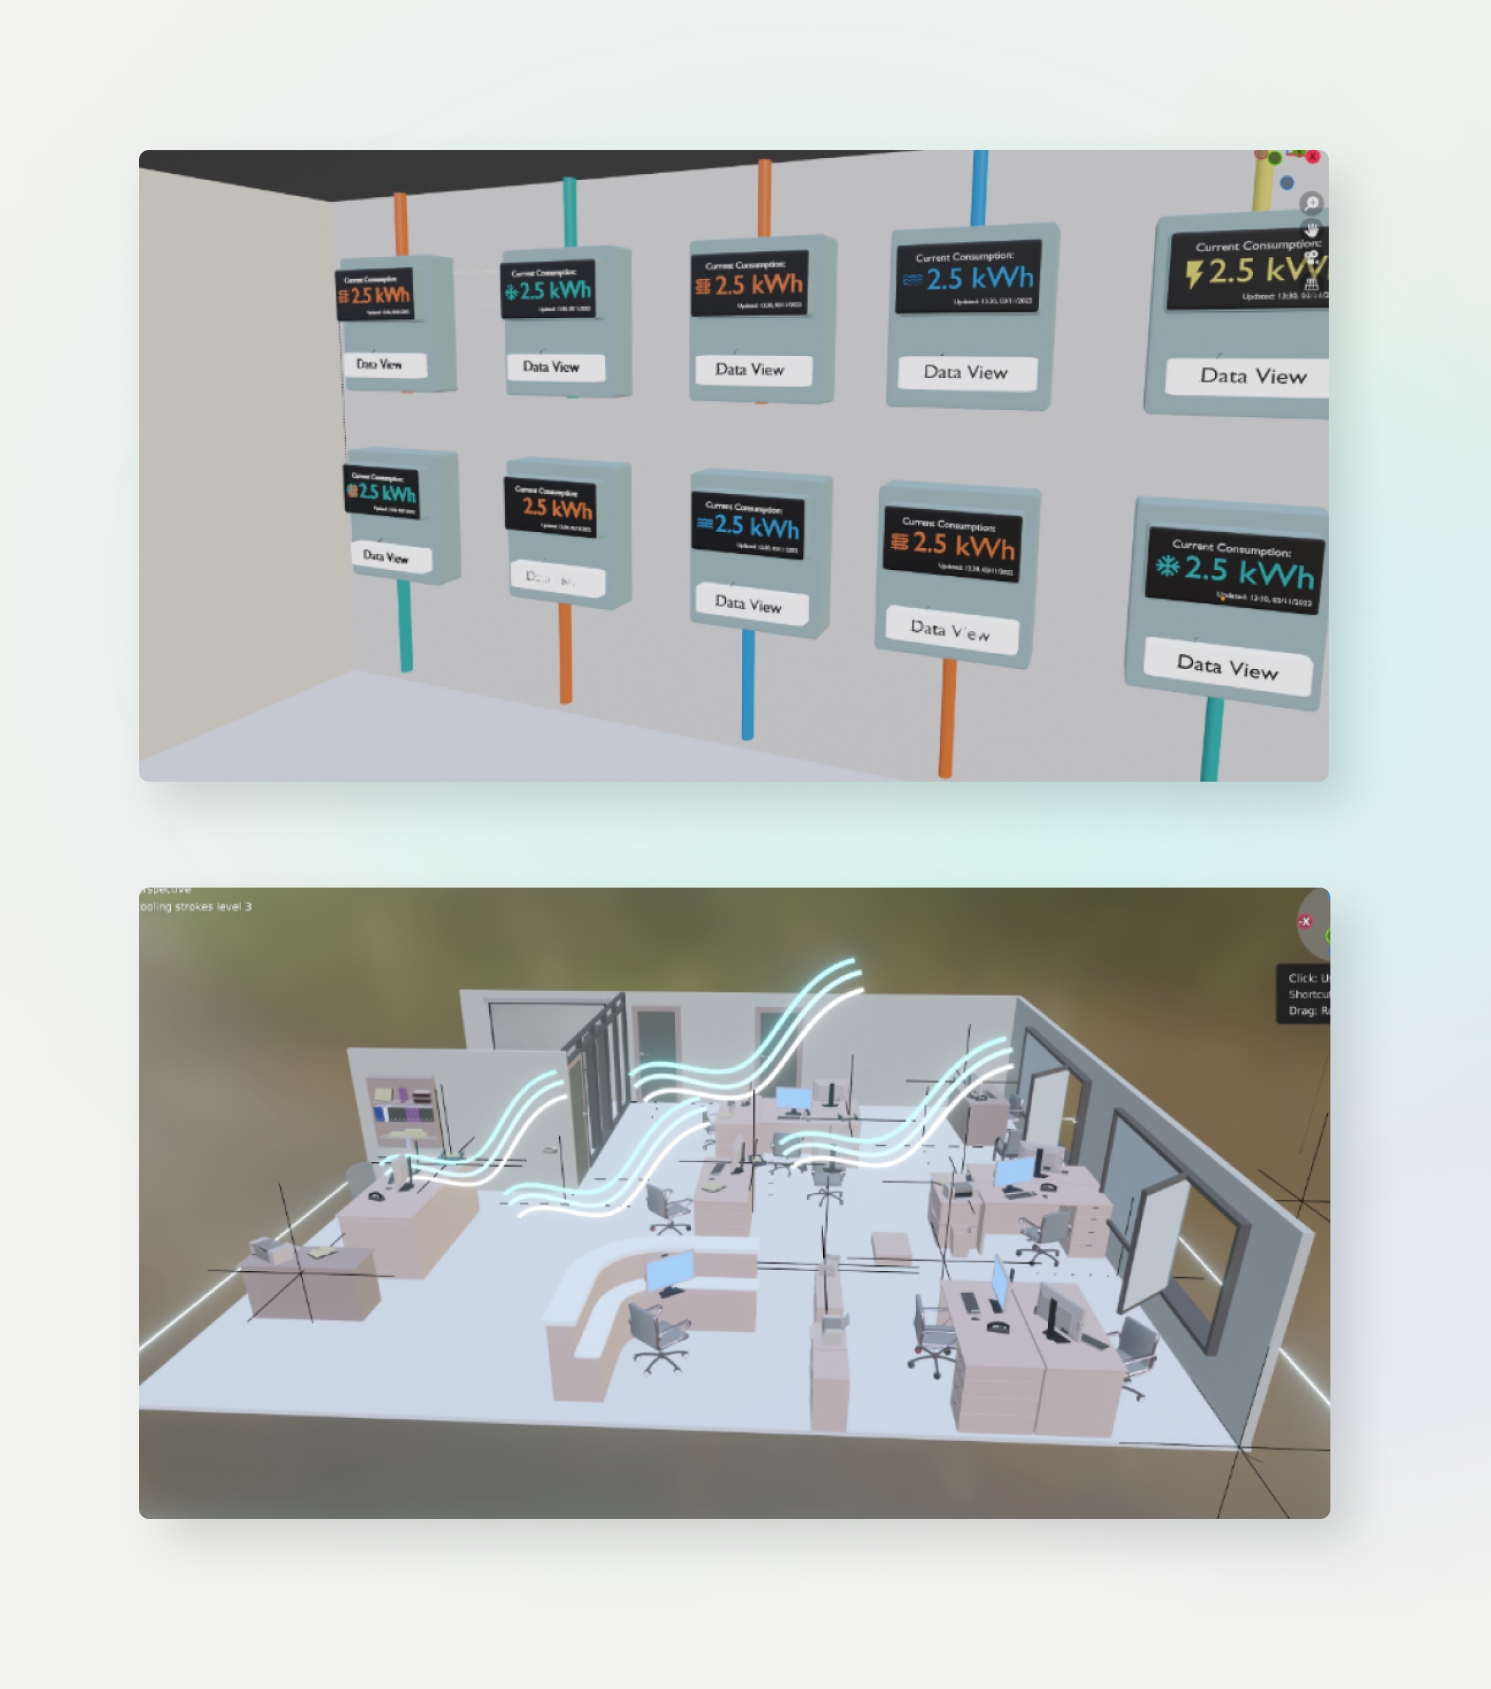
User flow with 3D data visualizations for real-time consumption data in the 3D Building WDF49 - real-time data points were provided by facility management.
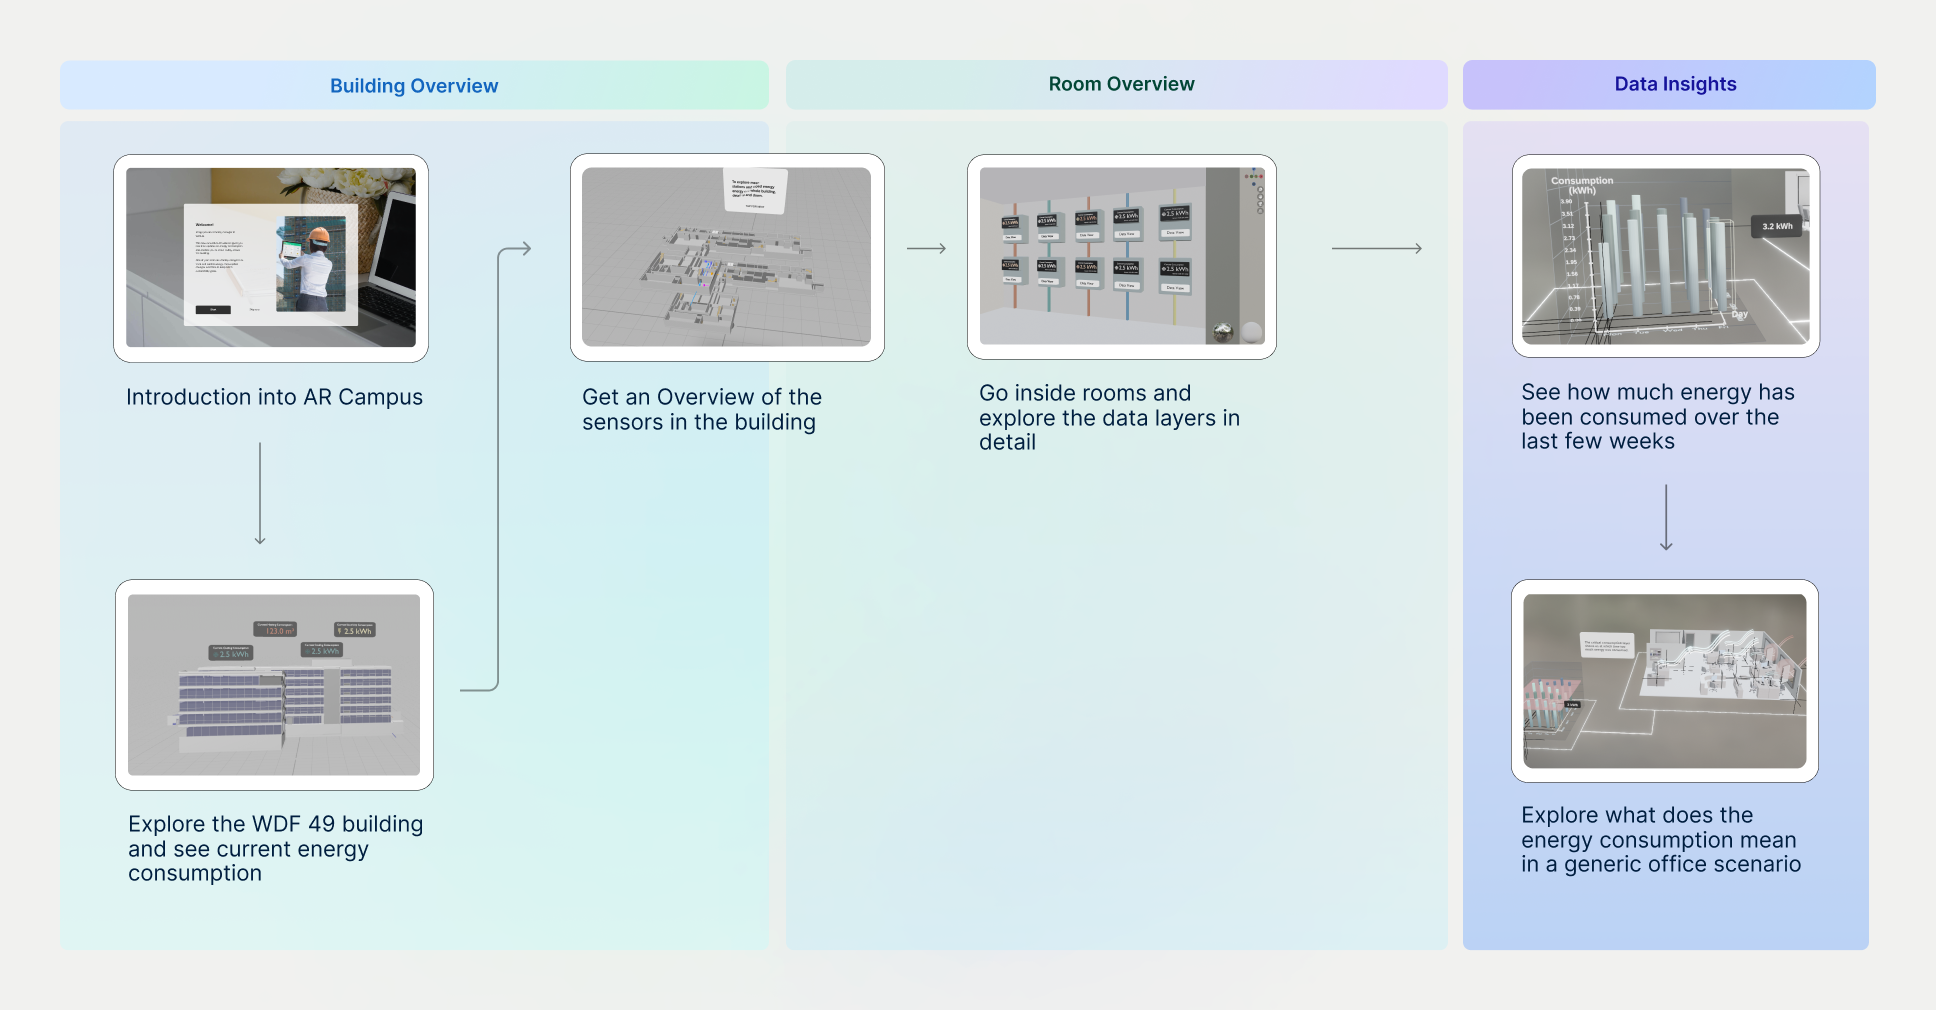
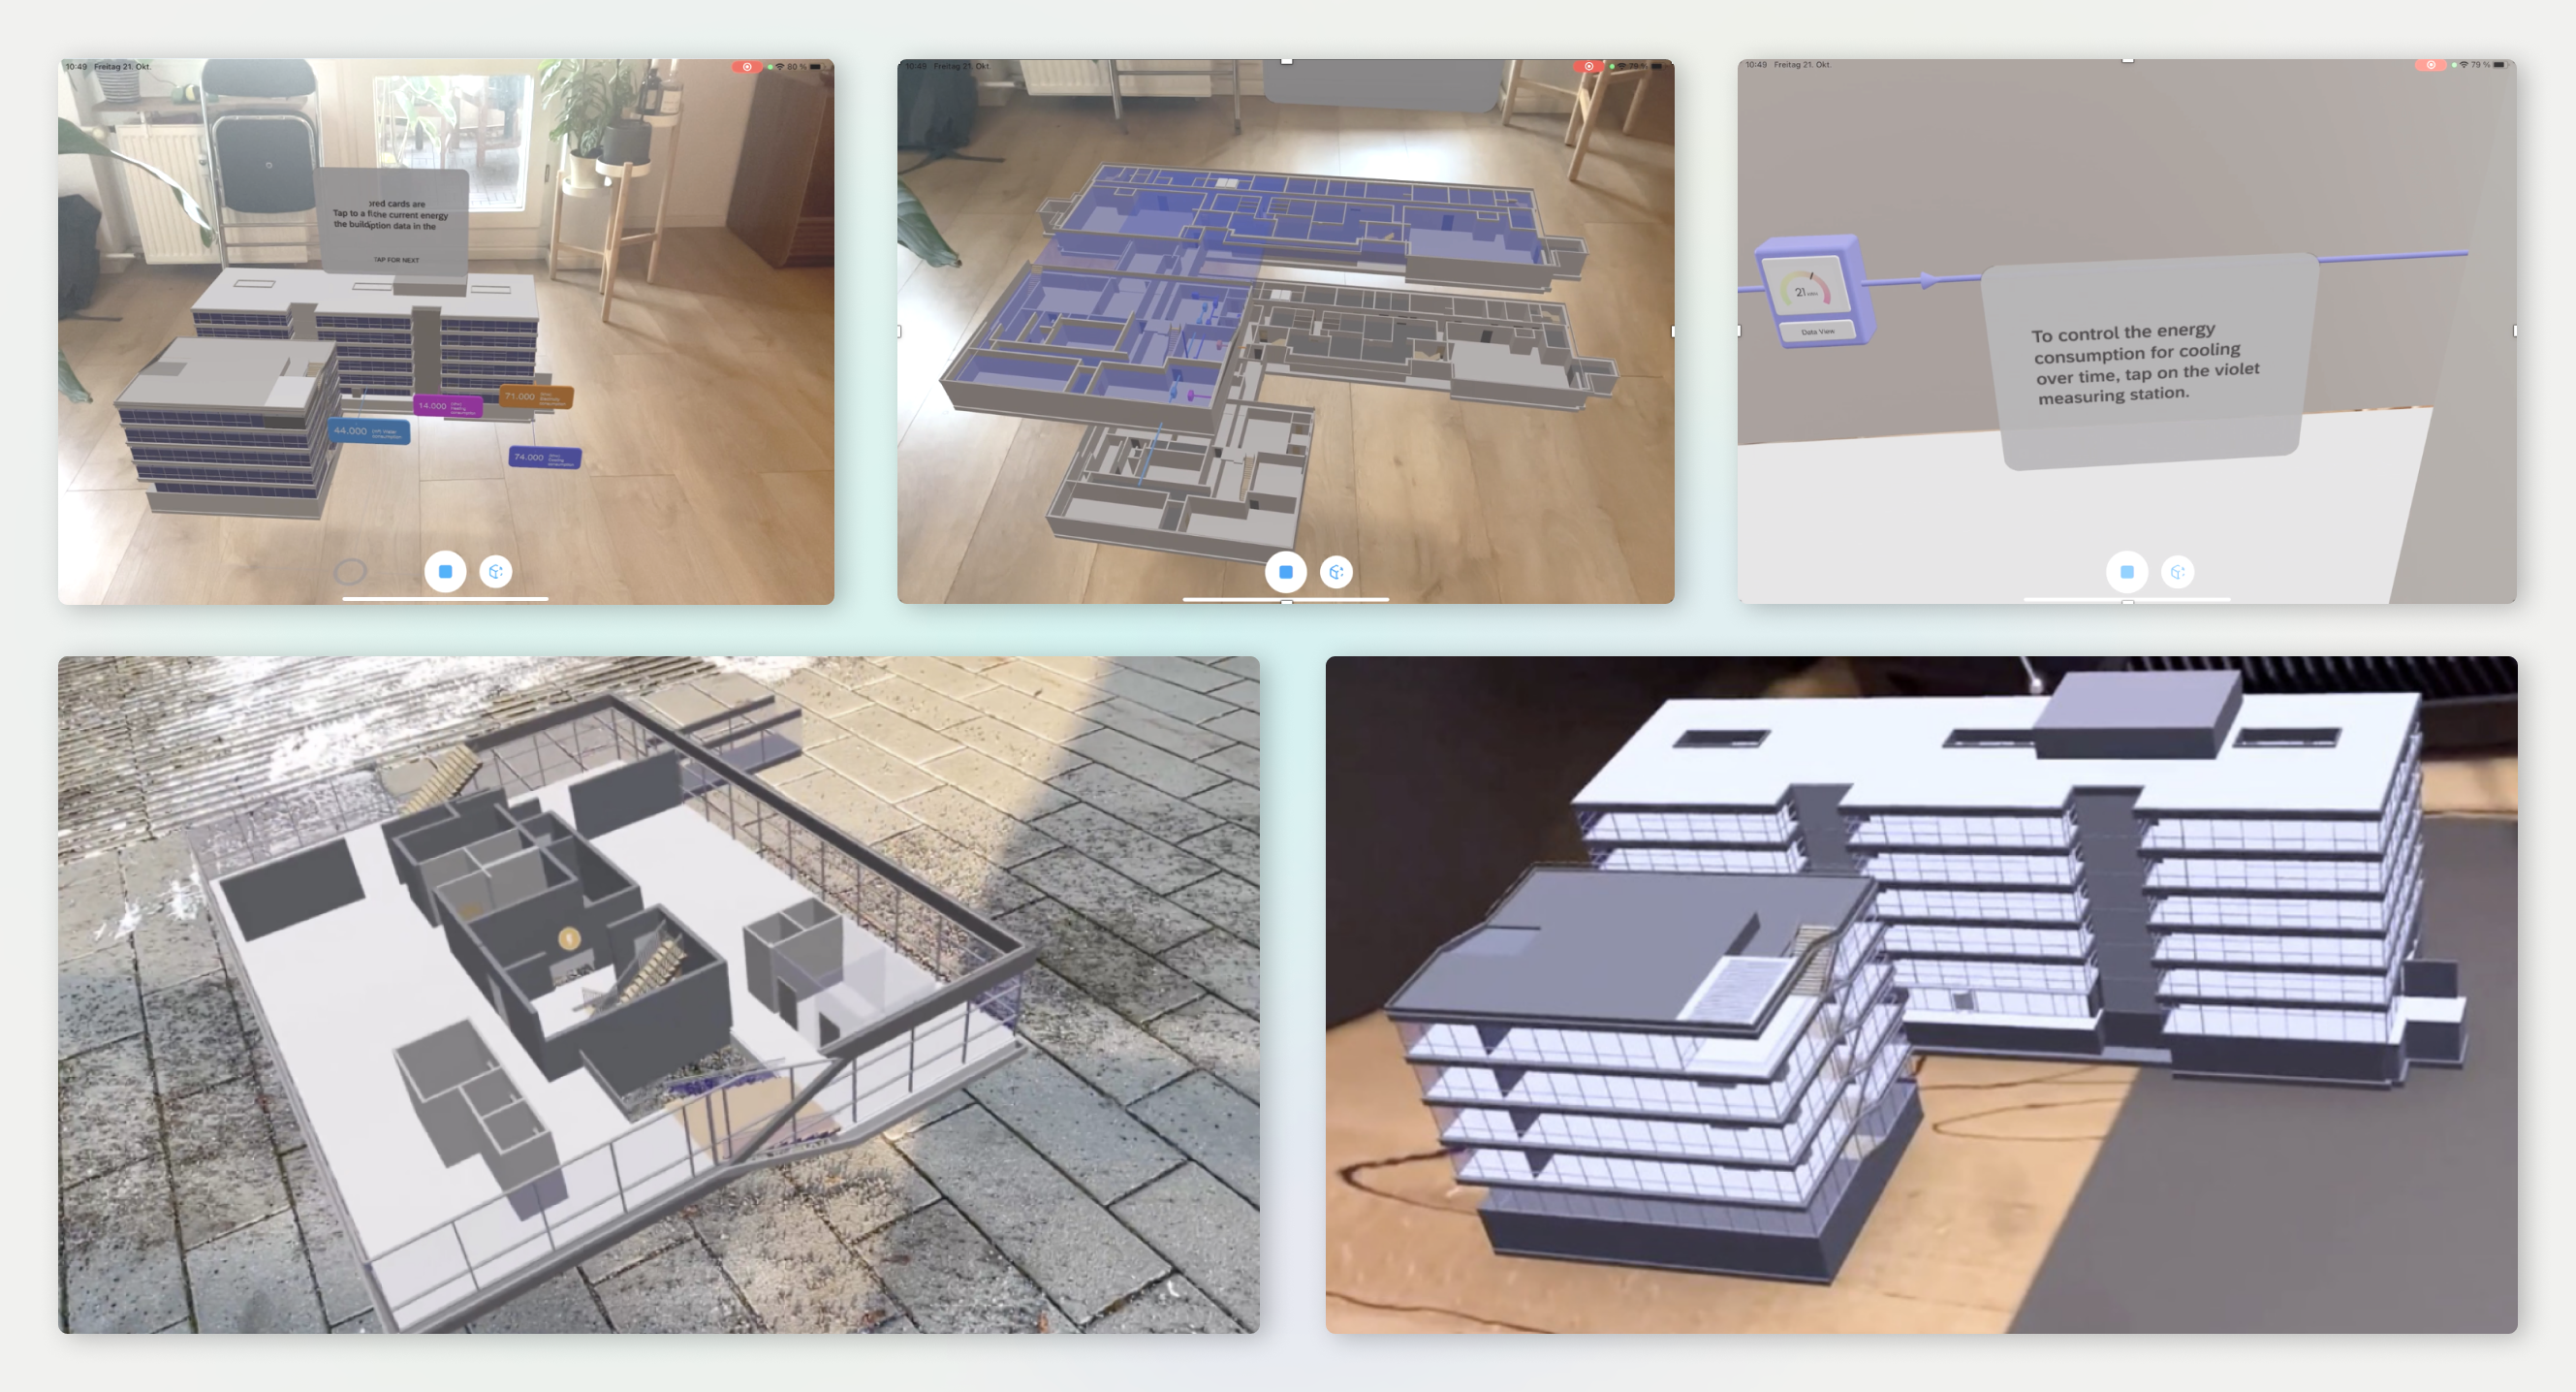
3D visualisation experiments in Blender with different plugins showing various data visualization techniques for energy consumption
3D visualisation experiments in Blender with different plugins

โ–ถ๏ธ Interaction flow

Interaction flow diagram showing three main sections: Building Overview, Room Overview, and Data Insights with screenshots of the AR experience at each level
Detailed AR interface showing four panels: Building overview with energy consumption labels, Floor overview with sensor locations, Room overview with measurement displays, and Data overview with 3D visualization of consumption metrics
Different levels of data visualization in the AR experience: building, floor, room, and detailed data views

โœ๏ธ Prototype

3D models showing energy consumption displays in a room and an office space with glowing energy flow lines
We used Blender to produce new and adapt existing 3D models and content for better visualizations
AR application screenshots showing building model, floor plan, and interface elements in a real environment
We used Apple's RealityKit as framework to simulate and render 3D content for AR apps - both for testing purposes and prototype showcase

๐Ÿ“ก Future steps

Incorporating outdoor temperature data to better understand energy consumption causes

Access data charts in each layer/building view (different layers of aggregation)

Accessing data on employee workspace usage

Expanding the showcase to more office SAP buildings

๐Ÿ“ berlin